
Products, Services, and Prospect Theory
Behavioral science is now an influential part of economics. It needs to become a more important part of the discipline of innovation. Although the discussion below is somewhat speculative, it highlights important perceptual attributes of “customer value.” Prospect Theory inspired this discussion, but the focus is quite different. Therefore I call it “Customer Value Analysis,” a model to help better evaluate the relative merits of different forms and amounts of customer value.
Daniel Kahneman won the 2002 Nobel Price in economics for his pioneering work in behavioral economics. This was for research he did with Amos Tversky, called Prospect Theory (i.e., does a person select one prospect over another?). Unfortunately Tversky died before the Nobel Prize was granted. As described in Kahneman’s best selling book, Thinking Fast and Slow, their work repeatedly showed that economic models based on human rationality are usually wrong. Human perception is highly non-linear and human decision-making is highly illogical.
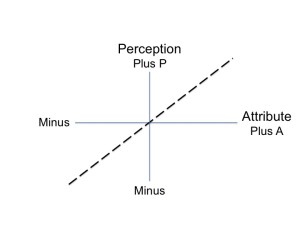
Economists use “utility functions” to describe the perceived “goodness” or “badness” of an attribute, such as increasing or decreasing income. The simplest utility function is shown in Figure 1, a straight line. The horizontal axis represents an attribute, A, like money, and the vertical axis represents how a person perceives it, P.
In this discussion P will often represent perceived customer value. The total customer value of a product is generally made up of many discrete parts, such as its function, price, maintenance, design elements, ease of use, service, experiences, and brand identity.
Previously we defined innovation as the creation and delivery of new customer value in the marketplace with a sustainable business model. A defining characteristic of all innovations is the creation of surprising new knowledge. To remain competitive, the challenge for innovators is that customers quickly adapt to new knowledge, and then they must be surprised anew. Unfortunately companies often ignore many of the additional ways they could pleasantly surprise their customers. The discussion below is intended to help better understand the importance of those surprises and maximize the customer value.
The curve in Figure 1 says that if gaining $100 makes you feel good by some amount, Plus P, then $200 will make you feel twice as good, Plus 2P. On the negative side, the inverse is true. If you lose $100 you will feel Minus P bad. If you lose $200 you will feel Minus 2P bad.
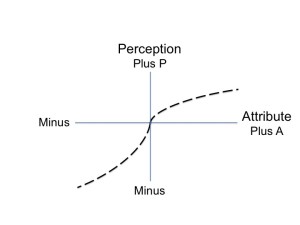
This simple model is incorrect. Most perceptual quantities are not linear; they are effectively logarithmic. Thus a noticeable change is a constant fraction of the initial quantity’s value. For example, if you turn a light up by 10% you will notice it is brighter. After adapting to the higher light level the light intensity must be increased by another 10% to create an equivalent change in brightness. These 10% increments in brightness hold roughly true over a very wide range of light intensities, well over 1,000 times.
For similar reasons we define customer value as (Customer benefits)/(customer costs). Costs can include price, convenience, set up time, and much more. Benefits include all the attributes that address customer’s needs.
Thus, a 10% improvement in the customer value of a product may be noticeable but it may not be perceptually significant. For example a 10% increase in Internet speed is unlikely to get a customer to change their service provider. To gain attention a 100%, or greater, improvement may be needed. Transforming a market with a disruptive innovation can require increases in customer value of 10 times or more.
I have sat through hundreds of presentations where the speaker said; “Our solution is much better because it is faster.” When asked what faster meant, the answer would be 5-10%. Was that important? – most of the time, no.
I believe Moore’s Law, a 100% increase in computing speed at the same cost every 12-18 months, is as much a perceptual requirement as it is a technical result. More generally, new innovations must satisfy these human perceptual requirements. Thus, there is an unrelenting imperative to improve exponentially.
Figure 2 is a chart fashioned after the results of Kahneman and Tversky. They showed that the general utility function is log-like, as shown by the line in the positive quadrant bending over to the right. In the negative quadrant the line’s shape is the same, but with one major difference – it is two-times lower than the line in the positive quadrant. That is, if receiving $100 makes you feel good by some amount, then taking away $100 will make you feel twice as bad. This is shown in Figure 3, where Plus A produces Plus P, but Minus A produces Minus 2P.
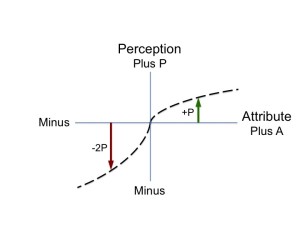
Kahneman and Tversky did hundreds of experiments to show the general properties of this function. The shape of the curve indicates that humans are profoundly nonlinear. Consider Figure 3 again. If you are playing winning poker, the downside (left of the green line) looks worse then the upside (right of the green line) looks good. That is, you become risk-averse.
Conversely if you are losing, the upside (right of the red line) looks better then the downside (left of the red line). You become risk taking. Perhaps this explains why the best poker players win so often. If they can act more rationally (or deceptively) than their opponents, they can take advantage of them whether they are winning or a losing.
One of the major achievements of Kahneman and Tversky is that the results shown in Figure 3 apply to most situations – it is very hard not to behave this way. It supports the familiar maxim, “It takes a lot of atta-boys to make up for one ah-shucks.” It actually suggests at least two atta-boys are needed to get back to zero and then another to get back on the positive side. That seems about right.
I had lunch with Kahneman and asked him if he thought Prospect Theory could be applied to consumer products. He cautiously said yes, but of course that was a casual discussion so his affirmation should be taken in context. I am applying these ideas beyond what Kahneman and Tversky proved or suggested. They are, at this point, a working hypothesis to help better understand several important cases.
The example I described to Kahneman was the 2007 Motorola Razr V3 shown in Figure 4, versus the first Apple iPhone shown in Figure 5. At the time Motorola’s Razr was a huge success. First introduced in 2004, it was the thinnest phone at the time with some additional clever features, including a see-through clamshell screen.

As noted, we quickly adapt when the lights are turned up slightly. We also adapt to new product innovations as the surprise of the innovation fades. For example, the thin Motorola Razr design, which made it originally so distinctive, became expected as competitive phones also became flat. To remain competitive, surprising new innovations became necessary. As importantly, disappointing elements had to be eliminated because of their large negative impact.
A further observation is that when a new product innovation is introduced, the older product features do not necessarily revert to zero value; they can have negative value. This happened to the Razr once the iPhone was introduced. The Razr’s once distinctive keyboard became seen as inconvenient, lacking functionality, and unattractive. Some of the Razr’s previous advantages ended up in the negative quadrant of Figure 3. The Razr was still a very good phone – that was its dominant customer value – but only drastic price reductions allowed it to survive. In 2012 Motorola Mobility was sold to Google who almost immediately sold it to Lenovo, headquartered in China.

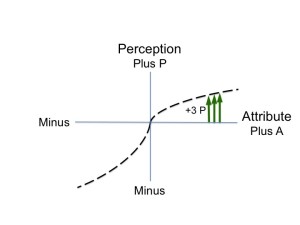
Notice from Figure 6 that the log-like shape of the utility curve means that many small positive surprises (e.g., the three green lines) are more impactful than one big equivalent surprise. That is, to create the largest impact, give a gift of $100 three times rather than $300 all at once (i.e., 3log100=6 versus log300=2.5).
These ideas are exemplified in the iPhone shown in Figure 5. It was flatter than the Razr and more elegant. These improvements provided additional customer value. In addition, the design of each iPhone screen icon was surprisingly delightful. After I bought my first iPhone I showed these features to my friends. Each icon represented new customer value. However, if even one of the icons had been pedestrian, it would have significantly reduced the customer value.
These general principles apply to most products, services, and experiences. At a restaurant or a hospital even a small negative event greatly diminishes the experience.
It follows that giving an employee multiple fractional bonuses over time is more effective than one large one. Or consider negotiation. Every small slipup by the other side is seen large in our minds. Considerable trust can be destroyed by one perceived slight. Getting back to a positive relationship takes many atta-boys. Conversely, a series of small “give ups” can have a surprisingly positive effect in moving a negotiation forward.
In more personal terms, bringing home a rose every night for your significant other can produce greater “customer value” than a dozen roses all at once. Forgetting a birthday, however, means you better bring home a dozen roses every day for a month!
I don’t know if Steve Jobs knew about Prospect Theory. But clearly he deeply understood the principals outlined here. He was obsessive about every product and service detail, including the product’s packaging and the design of Apple’s stores. He knew that many “small” positive surprises could add up to great customer value.
Core to Apple’s value proposition is that, “You are smart and distinguished if you buy Apple products.” Jobs also knew that even minor errors or incongruous actions could destroy this illusion.
What is remarkable is that so few companies embrace these principles. Many seem to believe that customers will not be bothered by “small” mistakes. That is not true. It results in lost customer value, and with it market share and profit. In the global innovation economy, where competition is so severe, maximizing customer value is required for survival.
Few technical enterprises have a Steve Jobs or Elon Musk as overall product architects, optimizing every aspect of customer value. Design by committee seldom achieves this goal. Traditionally we see these skills and understanding from high-end design and service companies, including segments of the fashion industry. Anna Wintour at Vogue is an example. Having a person with these skills and sensibilities is a major competitive advantage. The “spiritual partner” of Steve Jobs, Jonathan Ive, brilliantly played this role at Apple. But what will happen now that Jobs is gone?
Customer Value Analysis is part of the discipline of innovation to help innovators and entrepreneurs to be more efficient and effective. In a subsequent post I will further discuss elements of customer value (i.e., Benefits/Costs). I look forward to your ideas and continuing the conversation.
Note: All the models and numbers given are approximations. Developing utility functions is extremely complex and fraught with difficulties. It is far from an exact science.
2 Comments
Curt
sandeepsander
Hi Curt, Excellent points. I entirely agree that “Customer Value Analysis” can help innovators and entrepreneurs to be more efficient and effective. It is also useful for Senior Executives in large corporations – and for start-ups. The next key question is: how? In my experience several factors count; a leader with overall product architect is important. Building and constantly maintaining the right company culture is also essential. In addition it counts to have “the right people with the right competencies” on the team. This includes working across functions – and creating a winning group of organisations working together. For a few privileged organisations with global ambitions, sufficient funding and visions to create such a “dream team”, I highly recommend they include persons like you and your Practice of Innovation team.
Best regards
Sandeep
Sandeep SANDER, SanderMan Pte. Ltd. Singapore